In the realm of economics, the demand curve stands as one of the fundamental tools for understanding consumer behavior and market dynamics. It illustrates the relationship between the price of a product and the quantity demanded by consumers. In this article, we'll delve into what a demand curve is, how it's constructed, and its significance in economic analysis.
Table of content (toc)
What is a Demand Curve?
A demand curve is a graphical representation of the relationship between the price of a good or service and the quantity demanded by consumers. It shows how the quantity demanded changes as the price of the product varies, assuming all other factors remain constant. The demand curve is typically downward-sloping, indicating an inverse relationship between price and quantity demanded—the higher the price, the lower the quantity demanded, and vice versa.
How is a Demand Curve Constructed?
To construct a demand curve, economists collect data on the quantity demanded of a product at various price levels. This data is then plotted on a graph, with price on the vertical axis (y-axis) and quantity demanded on the horizontal axis (x-axis). Each point on the demand curve represents a specific price-quantity combination.
For example, consider the following demand curve for smartphones:
In this demand curve, as the price of smartphones increases from $200 to $600, the quantity demanded decreases from 500 to 100 units. The downward slope of the curve illustrates the law of demand—the higher the price, the lower the quantity demanded.
Significance of the Demand Curve
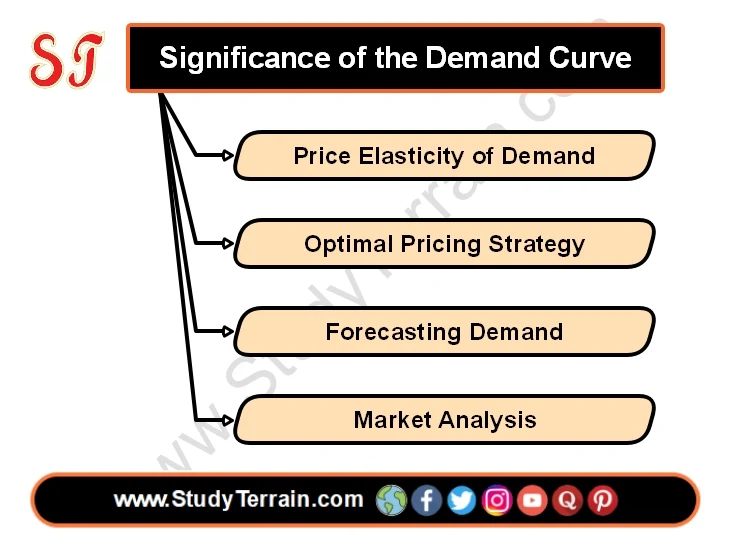
The demand curve is a crucial tool in economic analysis and decision-making for several reasons:
 |
| Significance of the Demand Curve |
Price Elasticity of Demand
The demand curve helps economists calculate the price elasticity of demand, which measures the responsiveness of quantity demanded to changes in price. By analyzing the slope of the demand curve, economists can determine whether demand for a product is elastic (responsive to price changes) or inelastic (insensitive to price changes).
Optimal Pricing Strategy
Businesses use the demand curve to determine the optimal pricing strategy for their products. By analyzing how changes in price affect quantity demanded, businesses can set prices that maximize revenue and profit.
Forecasting Demand
Demand curves provide valuable insights into future consumer behavior. By analyzing historical data and trends in the demand curve, businesses can forecast future demand for their products and adjust production and marketing strategies accordingly.
Market Analysis
Demand curves help businesses and policymakers understand market trends and dynamics. By comparing demand curves across different time periods or regions, businesses can identify opportunities for growth and expansion.
Conclusion
The demand curve is a fundamental concept in economics that provides valuable insights into consumer behavior and market dynamics. By illustrating the relationship between price and quantity demanded, the demand curve helps economists, businesses, and policymakers make informed decisions about pricing, production, and policy. As markets evolve and consumer preferences change, the demand curve remains a crucial tool for understanding and analyzing the complexities of the marketplace.
For more content visit KMBN 102


